Review
Similar Products
|
ATCC
r5f5 R5f5, supplied by ATCC, used in various techniques. Bioz Stars score: 90/100, based on 1 PubMed citations. ZERO BIAS - scores, article reviews, protocol conditions and more https://www.bioz.com/result/r5f5/product/ATCC Average 90 stars, based on 1 article reviews
r5f5 - by Bioz Stars,
2026-02
90/100 stars
|
Buy from Supplier |
|
Addgene inc
pbabe egfr del1  Pbabe Egfr Del1, supplied by Addgene inc, used in various techniques. Bioz Stars score: 93/100, based on 1 PubMed citations. ZERO BIAS - scores, article reviews, protocol conditions and more https://www.bioz.com/result/pbabe egfr del1/product/Addgene inc Average 93 stars, based on 1 article reviews
pbabe egfr del1 - by Bioz Stars,
2026-02
93/100 stars
|
Buy from Supplier |
|
Addgene inc
rrid addgene 32062 Rrid Addgene 32062, supplied by Addgene inc, used in various techniques. Bioz Stars score: 93/100, based on 1 PubMed citations. ZERO BIAS - scores, article reviews, protocol conditions and more https://www.bioz.com/result/rrid addgene 32062/product/Addgene inc Average 93 stars, based on 1 article reviews
rrid addgene 32062 - by Bioz Stars,
2026-02
93/100 stars
|
Buy from Supplier |
|
Addgene inc
del19  Del19, supplied by Addgene inc, used in various techniques. Bioz Stars score: 93/100, based on 1 PubMed citations. ZERO BIAS - scores, article reviews, protocol conditions and more https://www.bioz.com/result/del19/product/Addgene inc Average 93 stars, based on 1 article reviews
del19 - by Bioz Stars,
2026-02
93/100 stars
|
Buy from Supplier |
|
Addgene inc
pbabe egfr del exon19 Pbabe Egfr Del Exon19, supplied by Addgene inc, used in various techniques. Bioz Stars score: 93/100, based on 1 PubMed citations. ZERO BIAS - scores, article reviews, protocol conditions and more https://www.bioz.com/result/pbabe egfr del exon19/product/Addgene inc Average 93 stars, based on 1 article reviews
pbabe egfr del exon19 - by Bioz Stars,
2026-02
93/100 stars
|
Buy from Supplier |
|
Addgene inc
plasmid pbabe egfr del1 Plasmid Pbabe Egfr Del1, supplied by Addgene inc, used in various techniques. Bioz Stars score: 93/100, based on 1 PubMed citations. ZERO BIAS - scores, article reviews, protocol conditions and more https://www.bioz.com/result/plasmid pbabe egfr del1/product/Addgene inc Average 93 stars, based on 1 article reviews
plasmid pbabe egfr del1 - by Bioz Stars,
2026-02
93/100 stars
|
Buy from Supplier |
|
Addgene inc
19del mutant plasmid 32062 sequences  19del Mutant Plasmid 32062 Sequences, supplied by Addgene inc, used in various techniques. Bioz Stars score: 93/100, based on 1 PubMed citations. ZERO BIAS - scores, article reviews, protocol conditions and more https://www.bioz.com/result/19del mutant plasmid 32062 sequences/product/Addgene inc Average 93 stars, based on 1 article reviews
19del mutant plasmid 32062 sequences - by Bioz Stars,
2026-02
93/100 stars
|
Buy from Supplier |
|
Addgene inc
exon 19 del t790m plasmids Exon 19 Del T790m Plasmids, supplied by Addgene inc, used in various techniques. Bioz Stars score: 93/100, based on 1 PubMed citations. ZERO BIAS - scores, article reviews, protocol conditions and more https://www.bioz.com/result/exon 19 del t790m plasmids/product/Addgene inc Average 93 stars, based on 1 article reviews
exon 19 del t790m plasmids - by Bioz Stars,
2026-02
93/100 stars
|
Buy from Supplier |
Image Search Results
Journal: bioRxiv
Article Title: Prolonging lung cancer response to EGFR inhibition by targeting the selective advantage of resistant cells
doi: 10.1101/2023.06.19.545595
Figure Lengend Snippet: A. Cell viability assay of PC9 cells treated for 5 days with pemetrexed (100, 50 or 10 nM; Pem) and gefitinib (1 µM; Gef), alone or in combination. The fraction of viable cells was measured by CellTiter-Glo and normalized to the DMSO treated control. The mean ± SEM (n=6) of one representative of three independent experiments is shown. B. A mass population of PC9 cells containing a small pool of cells bearing the EGFR-T790M mutation generated by CRISPR-barcoding was treated with gefitinib (1 µM) alone or in combination with pemetrexed (50 nM) for 6 days. The proportion of EGFR-T790M cells was assessed by qPCR from genomic DNA and normalized using EGFR_Ctrl primers. Mean ± SEM (n=4) of one representative of three independent experiments. *p < 0.05 (Mann-Whitney test). C. Violin plot illustrating the EGFR-score difference between responders (R) and non-responders (NR) from a cohort of renal cell carcinoma patients treated with sorafenib. The EGFR-score was calculated based on the transcriptomic profiles of the tumors before the treatment. The p value was estimated by using the Student t-test. D. PC9, HCC4006 or HCC827 NSCLC cells containing EGFR-T790M-mutant subpopulations generated by CRISPR barcoding were treated with gefitinib (1 µM) alone or in combination with sorafenib (5 µM; Soraf) for 5 days and the proportion of EGFR-T790M cells was assessed as in B. Mean ± SEM (n=4) of one representative of at least three independent experiments. *p < 0.05 and **p < 0.01 (Mann-Whitney test). E. PC9 and H1975 cells and YU-1150 patient-derived cells (PDC) containing EGFR-C797S-subpopulations were treated with osimertinib (0,1 µM, Osim) alone or in combination with sorafenib (5 µM) for 10 days and the proportion of EGFR-C797S-barcoded cells was measured. Mean ± SEM (n=4) of one representative of at least three independent experiments. F. PC9 and H1975 cells described in E were treated with osimertinib alone (1 µM for PC9 cells, 0,1 µM for H1975 cells) or in combination with sorafenib (5 µM) for 20 days (PC9 cells) or 15 days (H1975 cells). The cells were then fixed and stained with crystal violet. G. Effects of osimertinib alone (0,1 µM) or in combination with sorafenib (5 µM), sunitinib (1 µM; Sun), regorafenib (2 µM; Reg), lenvatinib (1 µM; Lenv) or cabozantinib (5 µM; Cab) in EGFR-C797S-CRISPR-barcoded PC9 cells. The cells were treated for 7 (left panel) or 10 (right panel) days, and the proportion of the EGFR-C797S subpopulation was measured by qPCR. The mean ± SEM (n=5 or n=4) of one representative of three experiments is shown. H. Cell viability of parental or osimertinib-resistant (OR-PC9, EGFR-T790M/C797S) PC9 cells treated for 5 days as indicated with osimertinib (0,1 µM), sorafenib (5 µM), sunitinib (1 µM) or cabozantinib (5 µM). I. Colony forming assay representative images of parental, gefitinib-resistant/osimertinib-sensitive (GR-PC9, EGFR-T790M) or osimertinib-resistant PC9 cells treated for 5 days with osimertinib (1 µM) or sorafenib (5 µM), alone or in combination. J. Diagram representing the effects of the indicated treatments on a mixed population of EGFR-TKI-sensitive (yellow) and EGFR-TKI-resistant (red) NSCLC cells. K. The KRAS-G12D mutation was inserted by CRISPR-barcoding in a subpopulation of H358 cells, and the cells were treated with or without sotorasib (10 nM; Sotor), alone or in combination with sorafenib (5 μM) for 12 days. The proportion of the mutant barcode was assessed by qPCR from genomic DNA and normalized using EGFR_Ctrl primers. Mean ±SEM (n=4) of one representative of three experiments. L. Colony forming assay representative images of parental or KRAS-G12D bearing, sotorasib-resistant (SR) H358 cells treated for 8 days with sotorasib (10 nM) or sorafenib (5 µM), alone or in combination.
Article Snippet: Flag-tagged wt and Ex19Del human EGFR constructs in the lentiviral VIRSP vector were generated by PCR with Herculase II Fusion DNA Polymerase (Agilent technologies) from EGFR WT (a gift from Matthew Meyerson, Addgene plasmid # 11011) ( ) and
Techniques: Viability Assay, Control, Mutagenesis, Generated, CRISPR, MANN-WHITNEY, Derivative Assay, Staining
Journal: bioRxiv
Article Title: Prolonging lung cancer response to EGFR inhibition by targeting the selective advantage of resistant cells
doi: 10.1101/2023.06.19.545595
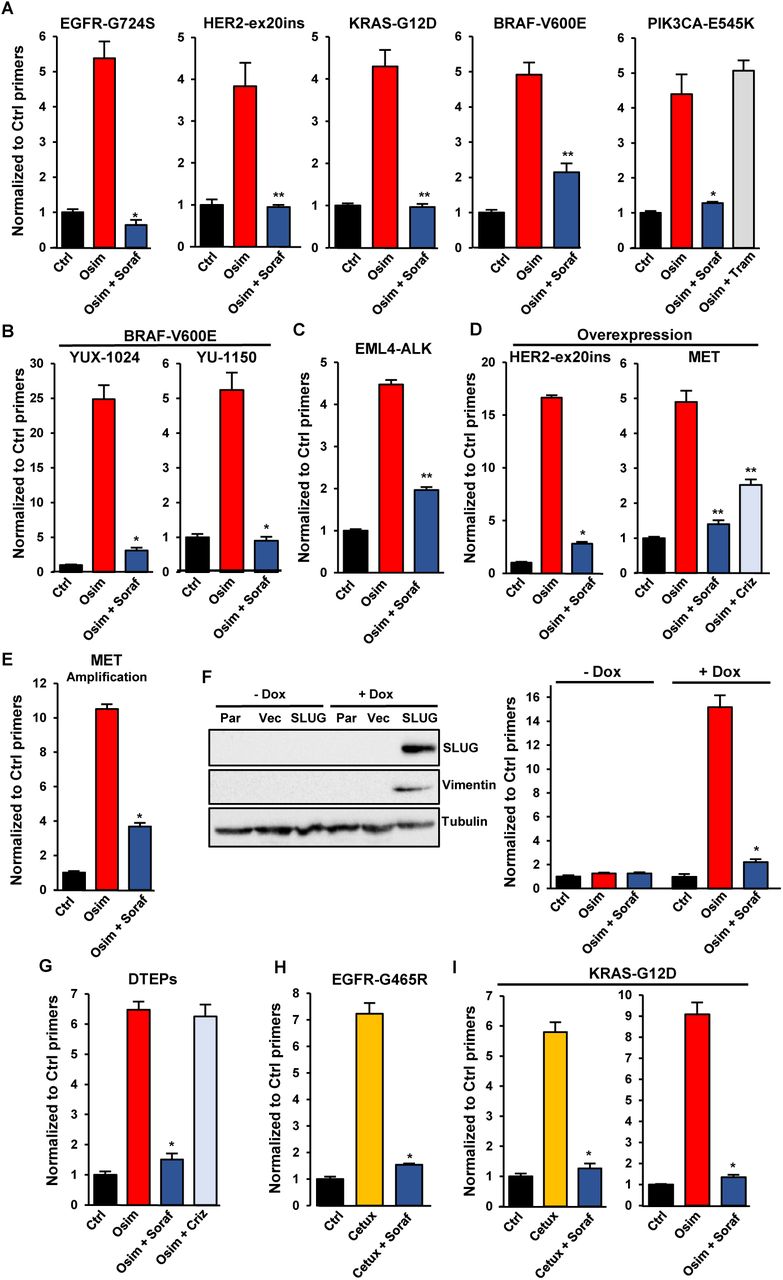
Figure Lengend Snippet: A. CRISPR-barcoding was used to generate PC9 cell subpopulations containing EGFR-G724S, HER2-ex20ins (HER2-A775insV-G776C), KRAS-G12D, BRAF-V600E or PIK3CA-E545K mutations, and the cells were treated with or without osimertinib (0,1 μM), alone or in combination with sorafenib (5 μM) or trametinib (10 nM; Tram) for 7 (BRAF-V600E), 10 (EGFR-G724S and KRAS-G12D), 15 (PIK3CA-E545K) or 20 (HER-ex20ins) days. The proportions of the mutant barcodes were assessed by qPCR from genomic DNA and normalized using EGFR_Ctrl primers. Mean ±SEM (n=4) of one representative of at least three experiments. *p < 0.05 and **p < 0.01 (Mann-Whitney test). B. The BRAF-V600E mutation was introduced by CRISPR/Cas9 in YUX-1024 and YU-1150 PDCs, followed by selection in the presence of osimertinib (0,1 μM). The mutant cells were mixed with parental cells (1 to 100 ratio), and the resulting cell population was treated with osimertinib (0,1 μM, 7 days) alone or in combination with sorafenib (5 μM). The proportion of the BRAF-V600E barcode was measured by qPCR. Mean ±SEM (n=4) of one representative of three experiments. C. The EML4-ALK chromosomal inversion was induced by CRISPR/Cas9 in a small subpopulation of PC9 cells. The proportion of mutant cells was assessed after treatment in the presence or the absence of osimertinib (0,1 µM, 10 days), alone or in combination with sorafenib (5 µM). D. Overexpression of HER2-A775insYVMA (HER-ex20ins) in PC9 cells was induced by transduction with a lentiviral vector. MET overexpression was induced using a dCas9 activator system through a sgRNA targeting the MET gene, followed by two-week selection in the presence of osimertinib (0,1 μM). The cells overexpressing HER-ex20ins or MET were mixed with parental PC9 cells (1 to 100 ratio) and treated with osimertinib (0,1 μM) alone or in combination with sorafenib (5 μM) or crizotinib (1 µM; Criz) for 10 (HER-ex20ins) or 15 (MET) days. The proportion of cells overexpressing HER-ex20ins or MET was assessed by qPCR from genomic DNA using vector specific primers and normalized using EGFR_Ctrl primers. Mean ±SEM (n=4 for HER2-ex20ins; n=5 for MET) of one representative of three experiments. E. EGFR-TKI resistant HCC827-GR6 cells were transduced with a lentiviral vector and mixed with parental HCC827 in a 1 to 100 ratio. The cells were then treated for 6 days with osimertinib (0,1 µM) alone or in combination with sorafenib (5 µM), and the proportion of HCC827-GR6 cells was measured by qPCR using vector specific primers. The mean ±SEM (n=4) of one representative of three different experiments is represented. F. PC9 cells were transduced with an empty lentiviral vector (Vec) or a vector for inducible expression of the EMT transcription factor SLUG (SLUG), followed by a 7 day treatment in the presence or the absence of doxycycline (1 µg/ml). Immunoblot (left panel) was performed using anti-SLUG, anti-vimentin and anti-tubulin antibodies. Parental PC9 (Par) were used as negative control. Cells containing the SLUG vector, pre-treated or not with doxycycline for at least one week, were mixed with parental PC9 (1 to 100 ratio) and treated for 7 days with osimertinib (0,1 µM) alone or in combination with sorafenib (5 µM). The proportion of cells containing the lentiviral vector was assessed by qPCR. Mean ±SEM (n=4) of one representative of three experiments. G. PC9 cells labeled with a control lentivirus were selected in the presence of osimertinib (0,1 µM) for 3 weeks to obtain a population of drug-tolerant expanded persisters (DTEPs), then mixed with parental cells (1 to 100 ratio). The proportion of DETPS was assessed by qPCR from genomic DNA using primers specific to the lentiviral vector after a 15-day treatment with osimertinib (0,1 µM) alone or in combination with sorafenib (5 µM) or crizotinib (0.5 µM). The mean ±SEM (n=4) of one representative of three experiments is represented. H-I. The EGFR-G465R (H) or KRAS-G12D (I) mutations were introduced by CRISPR-barcoding in a subpopulation of LIM1215 CRC cells, and the proportion of mutant cells was assessed after 6 days in the presence or the absence of cetuximab (20 µg; Cetux) or osimertinib (1 µM), alone or in combination with sorafenib (5 μM). The mean ±SEM (n=3 for EGFR-G465R; n=4 for KRAS-G12D) of one representative of three different experiments is represented.
Article Snippet: Flag-tagged wt and Ex19Del human EGFR constructs in the lentiviral VIRSP vector were generated by PCR with Herculase II Fusion DNA Polymerase (Agilent technologies) from EGFR WT (a gift from Matthew Meyerson, Addgene plasmid # 11011) ( ) and
Techniques: CRISPR, Mutagenesis, MANN-WHITNEY, Selection, Over Expression, Transduction, Plasmid Preparation, Expressing, Western Blot, Negative Control, Labeling, Control

Journal: bioRxiv
Article Title: Prolonging lung cancer response to EGFR inhibition by targeting the selective advantage of resistant cells
doi: 10.1101/2023.06.19.545595
Figure Lengend Snippet: A. PC9 cells were treated for 10 to 60 minutes (min) with sorafenib (5 µM) or the MEK inhibitor trametinib (50 nM,), followed by immunoblot using the indicated antibodies. B. YUX-1024 and YU-1150 PDCs were treated for 2h with sorafenib (5 µM), osimertinib (0,1 µM), the MNK inhibitor eFT-508 (1 µM; eFT) or trametinib (50 nM; Tram), and immunoblot was performed using the indicated antibodies. C. PC9 cells transduced with a lentiviral vector for inducible expression of a constitutively active form of Flag-tagged MNK2 (CA-MNK2) were pre-treated with or without doxycycline (0,1 μg/ml; Dox) for 12h, followed by 1h treatment with sorafenib (5, 10 or 20 µM), eFT-508 (20 μM, positive control) or trametinib (1 μM, negative control). Immunoblot was performed using the indicated antibodies. D. Flag-tagged eIF4E was immunoprecipitated from transfected 293T cells and in vitro kinase assay was performed using recombinant active MNK2 (rMNK2) in the presence or the absence of the indicated concentrations of sorafenib, trametinib or eFT-508. Immunoblot was performed using anti-phospho-eIF4E, anti-MNK2 and anti-Flag antibodies. E. PC9 cells were treated with sorafenib (5 µM) or trametinib (50 nM) for 6h, followed by immunoblot using the indicated antibodies. F. PC9 cells were treated with or without sorafenib (5 µM) for 24, 48 or 72h, followed by immunoblot using the indicated antibodies. G. YU-1150 and YUX-1024 PDCs were treated with or without sorafenib (5 µM) for 3 days, followed by immunoblot using the indicated antibodies. H. EGFR-T790M CRISPR-barcoded PC9 cells were treated with gefitinib (1 µM) alone, or with sorafenib (5 µM) or a combination of the three inhibitors napabucasin (0.5 µM, STAT3 inhibitor), S63845 (0.1 µM, MCL1 inhibitor) and eFT-508 (1 µM; iESM) in 5% FBS medium for 5 days. The proportion of the EGFR-T790M barcode was measured by qPCR from genomic DNA and normalized using EGFR_Ctrl primers. Mean ±SEM (n=5) of one representative of three experiments. *p < 0.05 (Mann-Whitney test).
Article Snippet: Flag-tagged wt and Ex19Del human EGFR constructs in the lentiviral VIRSP vector were generated by PCR with Herculase II Fusion DNA Polymerase (Agilent technologies) from EGFR WT (a gift from Matthew Meyerson, Addgene plasmid # 11011) ( ) and
Techniques: Western Blot, Transduction, Plasmid Preparation, Expressing, Positive Control, Negative Control, Immunoprecipitation, Transfection, In Vitro, Kinase Assay, Recombinant, CRISPR, MANN-WHITNEY

Journal: bioRxiv
Article Title: Prolonging lung cancer response to EGFR inhibition by targeting the selective advantage of resistant cells
doi: 10.1101/2023.06.19.545595
Figure Lengend Snippet: A. Time-course effects of sorafenib (5 µM) in PC9 cells. Immunoblot was performed using the indicated antibodies. Anti-eIF4E was used as a loading control. B. YUX-1024 and YU-1150 PDCs were treated with sorafenib (5 µM) for 5 days, followed by immunoblot using anti EGFR and anti-tubulin antibodies. C. PC9 cells were transduced with a lentiviral vector containing Flag-tagged EGFR-Ex19Del and the green fluorescent protein (GFP), separated by the T2A self-cleaving peptide and under the control of the PGK promoter. Two different clones were isolated and treated for 3 days in the presence or the absence of sorafenib (5 µM). The expression of EGFR and GFP was measured by immunoblot (upper panel) and FACS (lower panel), respectively. D. PC9 cells were transduced with lentiviral vectors containing either Ex19Del-mutant or wt Flag-tagged EGFR, and two clones per condition were isolated. The clones were treated in the presence or the absence of sorafenib (5 µM) for 3 days, and immunoblot was performed using anti-Flag and anti-tubulin antibodies. E. PC9 cells were treated with sorafenib (5 µM) alone or in combination with different concentrations of chloroquine (ChQ) for 3 days, followed by immunoblot with anti-EGFR and anti-tubulin antibodies. F. PC9 cells containing the EGFR-T790M CRISPR-barcode were treated with gefitinib (1 µM) alone or in combination with sorafenib (5 µM), with or without chloroquine (20 µM) for 4 days. Genomic DNA was derived and the proportion of the EGFR-T790M barcode was measured by qPCR and normalized using the EGFR_Ctrl primers. The mean ±SEM (n=5) of one representative of three experiments is represented. **p < 0.01 (Mann-Whitney test).
Article Snippet: Flag-tagged wt and Ex19Del human EGFR constructs in the lentiviral VIRSP vector were generated by PCR with Herculase II Fusion DNA Polymerase (Agilent technologies) from EGFR WT (a gift from Matthew Meyerson, Addgene plasmid # 11011) ( ) and
Techniques: Western Blot, Control, Transduction, Plasmid Preparation, Clone Assay, Isolation, Expressing, Mutagenesis, CRISPR, Derivative Assay, MANN-WHITNEY

Journal: bioRxiv
Article Title: Prolonging lung cancer response to EGFR inhibition by targeting the selective advantage of resistant cells
doi: 10.1101/2023.06.19.545595
Figure Lengend Snippet: A. Gene set enrichment analysis (GSEA) of genes up-regulated by EGFR-TKIs in NSCLC cells (KOBAYASHI_EGFR_SIGNALING_24HR_UP signature), performed on gene array data obtained from PC9 cells treated with osimertinib (1 µM) or sorafenib (5 µM), alone or in combination (Combo) for two days. Enrichment scores (ES) and p values are reported. B. The data described in A were analyzed using our osimertinib-sorafenib combination signature (COMBO_UP). C. Osimertinib sensitive and resistant PC9 cells were treated with osimertinib (1 µM) and sorafenib (5 µM), alone or in combination, for 3 days, followed by immunoblot using the indicated antibodies. D. PC9 cells containing highly complex CRISPR-barcodes in the AAVS1 locus were treated for two weeks with osimertinib (1 µM) and sorafenib (5 µM), alone or in combination (n=4 per condition). Barcodes enriched at least 5-fold over the control in 4 or 3 replicates are shown. E. Barcode heatmap and Ward’s hierarchical clustering of the four replicates per condition of the experiment described in C . F. Correlation matrix of the data shown in D . G. Pearson correlation of the barcode distribution in control versus osimertinib or control versus combination treated cells. The coefficients of determination (R 2 ) and the p value (Mann-Whitney test) are indicated.
Article Snippet: Flag-tagged wt and Ex19Del human EGFR constructs in the lentiviral VIRSP vector were generated by PCR with Herculase II Fusion DNA Polymerase (Agilent technologies) from EGFR WT (a gift from Matthew Meyerson, Addgene plasmid # 11011) ( ) and
Techniques: Western Blot, CRISPR, Control, MANN-WHITNEY

Journal: bioRxiv
Article Title: Prolonging lung cancer response to EGFR inhibition by targeting the selective advantage of resistant cells
doi: 10.1101/2023.06.19.545595
Figure Lengend Snippet: A. A PC9 mass population containing small pools (1 to 1000 ratio each) of EGFR-C797S (expressing GFP), KRAS-G12D (expressing β-galactosidase) and PIK3CA-E545K (expressing mCherrry) osimertinib-resistant cells were subcutaneously injected in the right and left flanks of SCID mice. Once the tumors reached a mean volume of about 200 mm 3 , the mice were sacrificed (Ctrl) or treated for 4 weeks with osimertinib (5 mg/kg) alone or in combination with sorafenib (60 mg/kg; Combo). 3D-imaging through iDISCO technology was performed to visualize the subpopulations of resistant cells. To maintain a similar size of the samples from different conditions, the tumors from osimertinib treated mice were cut in two. B. A mass population of PC9 cells containing a small pool of cells bearing the EGFR-C797S mutation generated by CRISPR-barcoding was injected in the right and left flanks of SCID mice. Once the tumors were palpable (arrow), the mice were randomized and treated with or without osimertinib (5 mg/kg) and sorafenib (60 mg/kg), alone or in combination, and the volume of the tumors was measured by caliper. The mean tumor volumes ± SEM are represented (n=5 mice per group). C. YUX-1024 PDCs containing a subpopulation (1 to 200 ratio) of BRAF-V600E resistant cells expressing GFP were subcutaneously injected in the right and left flanks of SCID mice. Once the tumors reached a mean volume of about 200 mm 3 , the mice were sacrificed (Ctrl) or treated for 4 weeks with osimertinib (10 mg/kg) alone or in combination with sorafenib (60 mg/kg), followed by 3D-imaging. Tumors from osimertinib-treated tumors were cut in two before staining to ensure comparable size of the samples. D. A mass population of YUX-1024 PDCs containing a pool of BRAF-V600E cells (1 to 200 ratio) was injected in the right and left flanks of SCID mice. When the tumors reached a mean volume of about 200 mm 3 , the mice were treated with vehicle, osimertinib (10 mg/kg), sorafenib (60 mg/kg) or a combination of the two inhibitors. The mean tumor volumes ± SEM are represented (n=6 mice for the control, n=8 for the other groups). E. Kaplan-Meier diagram of the experiment illustrated in D . The mice were sacrificed when the volume of at least one of the tumors exceeded 800 mm 3 .
Article Snippet: Flag-tagged wt and Ex19Del human EGFR constructs in the lentiviral VIRSP vector were generated by PCR with Herculase II Fusion DNA Polymerase (Agilent technologies) from EGFR WT (a gift from Matthew Meyerson, Addgene plasmid # 11011) ( ) and
Techniques: Expressing, Injection, Imaging, Mutagenesis, Generated, CRISPR, Staining, Control

Journal: bioRxiv
Article Title: Prolonging lung cancer response to EGFR inhibition by targeting the selective advantage of resistant cells
doi: 10.1101/2023.06.19.545595
Figure Lengend Snippet: A. A PC9 mass population containing small pools of EGFR-C797S, KRAS-G12D and PIK3CA-E545K CRISPR-barcoded or HER2-ex20ins overexpressing cells was injected in the right and left flanks of SCID mice. Once the tumors reached a mean volume of about 100 mm 3 , the mice were randomized and treated with either vehicle or osimertinib (5 mg/kg), alone or in combination with sorafenib (60 mg/kg) and the volume of the tumors was measured by caliper. The mean tumor volumes ± SEM are shown (n=6 mice for the control, n=10 mice for the other groups). B. Kaplan-Meier diagram of the experiment shown in A . The mice were sacrificed when the volume of at least one of the tumors exceeded 800 mm 3 . C. GSEA of the genes up-regulated by osimertinib, sorafenib or the combination in PC9 cells based on an inflammatory response signature. D. Mouse BEM-5 cells addicted to mutant EGFR were injected in the right and left flanks of syngeneic BALB/c mice. When the tumors reached a mean volume of about 50 mm 3 , the mice were treated for 10 days with vehicle, osimertinib (20 mg/kg), sorafenib (60 mg/kg) or a combination of the two inhibitors, followed by IHC analysis using the indicated antibodies. Images representative of three different tumors/mice per condition are shown. E. BEM-5 cells were injected in the right and left flanks of BALB/c mice. Once the tumors reached a mean volume of about 50 mm 3 , the mice were randomized and treated with either vehicle or osimertinib (20 mg/kg) alone or in combination with sorafenib (60 mg/kg). The mean tumor volumes ± SEM are shown (n=5 mice for control, n=6 mice for osimertinib and sorafenib, n=16 mice for the combination). F. Kaplan-Meier diagram of the experiment shown in E. The mice were sacrificed when the volume of at least one of the tumors exceeded 800 mm 3 .
Article Snippet: Flag-tagged wt and Ex19Del human EGFR constructs in the lentiviral VIRSP vector were generated by PCR with Herculase II Fusion DNA Polymerase (Agilent technologies) from EGFR WT (a gift from Matthew Meyerson, Addgene plasmid # 11011) ( ) and
Techniques: CRISPR, Injection, Control, Mutagenesis
Journal: Lung cancer (Amsterdam, Netherlands)
Article Title: Mutant forms of EGFR promote HER2 trafficking through efficient formation of HER2-EGFR heterodimers.
doi: 10.1016/j.lungcan.2022.11.018
Figure Lengend Snippet: Fig. 2. EGFR activating mutations promote HER2-EGFR heterodimerization in cancer cell lines without HER2 amplification. (A) z-Projection images were con structed by combination of optical sectioning images of multiple cells obtained by z-stacking. (B) Representative z-projection images obtained with an in situ PLA for HER2-EGFR heterodimers (green signals) in lung or breast cancer cell lines negative for HER2 amplification and either negative or positive for EGFR activating mutations. Nuclei (blue signals) were stained with DAPI. Scale bars, 20 µm. (C) Quantification of the number of HER2-EGFR heterodimers per cell from images as in (B). Data are means + SEM (left, n = 50 cells) or means ± SD (right, n = 6 cell lines). *p < 0.05 (unpaired Student’s t test). (D) Immunoblot analysis of HER2 and EGFR in lung and breast cancer cell lines. β-actin was examined as a loading control. (E) Relative MFI ratios for expression of HER2 and EGFR at the cell surface determined by flow cytometric analysis. Data are means + SD from three independent experiments. (F) Representative z-projection images obtained with an in situ PLA performed as in (B) for HER2-EGFR heterodimers in MCF7 cells infected with retroviruses encoding WT or mutant (del19 or L858R) forms of EGFR. (G) Number of HER2-EGFR heterodimers per cell for cells as in (F). Data are means + SEM (n = 50 cells). ****p < 0.0001 (one-way ANOVA). All data are representative of or from three independent experiments.
Article Snippet: For establishment of MCF7 cells stably expressing WT or mutant forms of EGFR, pBABE vectors for the WT protein (#11011; Addgene, Cambridge, MA, USA) or for
Techniques: Amplification, In Situ, Staining, Western Blot, Control, Expressing, Infection, Mutagenesis

Journal: Lung cancer (Amsterdam, Netherlands)
Article Title: Mutant forms of EGFR promote HER2 trafficking through efficient formation of HER2-EGFR heterodimers.
doi: 10.1016/j.lungcan.2022.11.018
Figure Lengend Snippet: Fig. 3. HER2 is rapidly internalized in cancer cell lines negative for HER2 amplification. HER2 amplification–negative lung cancer cell lines (A), HER2 amplifi cation–positive cell lines (B), and MCF7 cells infected with retroviruses encoding WT or mutant (del19 or L858R) forms of EGFR (C) were exposed to Tz-555 at 4 ◦C for 30 min, washed, and incubated at 37 ◦C beginning at time 0 min for live-cell imaging of Tz-555–labeled HER2 (yellow). Data are representative of two inde pendent experiments. Scale bars, 10 μm.
Article Snippet: For establishment of MCF7 cells stably expressing WT or mutant forms of EGFR, pBABE vectors for the WT protein (#11011; Addgene, Cambridge, MA, USA) or for
Techniques: Amplification, Infection, Mutagenesis, Incubation, Live Cell Imaging, Labeling

Journal: Lung cancer (Amsterdam, Netherlands)
Article Title: Mutant forms of EGFR promote HER2 trafficking through efficient formation of HER2-EGFR heterodimers.
doi: 10.1016/j.lungcan.2022.11.018
Figure Lengend Snippet: Fig. 6. EGFR activating mutations increase cell sensitivity to T-DM1. (A) Relation between the rela tive MFI ratio for HER2 at the cell surface and the median inhibitory concentration (IC50) value for cytotoxicity of T-DM1 for cancer cell lines classified according to HER2 amplification and EGFR activating mutation status. Data for MCF7 cells are not shown because the IC50 value was > 500 µg/ml. Data are means of triplicates from one experiment and are representative of three independent experiments. (B) Percentage cell viability for MCF7 cells stably expressing WT or mutant (del19 or L858R) forms of EGFR and exposed to T-DM1 (100 µg/ml) for 72 h. Data are means + SEM (n = 3 triplicates from one experiment, with the data being representative of three independent experiments). **p < 0.01, ***p < 0.001 (one-way ANOVA).
Article Snippet: For establishment of MCF7 cells stably expressing WT or mutant forms of EGFR, pBABE vectors for the WT protein (#11011; Addgene, Cambridge, MA, USA) or for
Techniques: Concentration Assay, Amplification, Mutagenesis, Stable Transfection, Expressing

Journal: Lung cancer (Amsterdam, Netherlands)
Article Title: Mutant forms of EGFR promote HER2 trafficking through efficient formation of HER2-EGFR heterodimers.
doi: 10.1016/j.lungcan.2022.11.018
Figure Lengend Snippet: Fig. 5. Internalized HER2 is efficiently transferred to lysosomes in EGFR mutation–positive cancer cells. (A) A549 and PC-9 cells were exposed to chloroquine, labeled with Tz-555 for 30 min at 4 ◦C, and then incubated for 2 h at 37 ◦C in the presence of chloroquine, after which they were stained with antibodies to LAMP1 and both Tz-555 (yellow) and LAMP1 (purple) signals were detected by fluorescence microscopy. Colocalization of Tz-555 and LAMP1 signals is indicated in white in the merged panels. Dashed lines indicate cell boundaries. Scale bars, 10 µm. (B) Quantification of Tz-555 colocalization with LAMP1 in cells as in (A). (C) MCF7 cells stably expressing WT or mutant (del19 or L858R) forms of EGFR were analyzed as in (A). Scale bars, 10 µm. (D) Quantification of Tz-555 colocalization with LAMP1 in cells as in (C). The representative images in (A) and (C) were obtained by optical sectioning. The quantitative data (n = 9 fields) in (B) and (D) are presented as box plots, with the boxes representing the median and 25th and 75th percentiles and the whiskers extending to maximum and minimum values. *p < 0.05, ***p < 0.001 (Mann-Whitney test); ****p < 0.0001 (unpaired Student’s t test). All data are representative of three independent experiments.
Article Snippet: For establishment of MCF7 cells stably expressing WT or mutant forms of EGFR, pBABE vectors for the WT protein (#11011; Addgene, Cambridge, MA, USA) or for
Techniques: Mutagenesis, Labeling, Incubation, Staining, Fluorescence, Microscopy, Stable Transfection, Expressing, MANN-WHITNEY
Journal: Molecular Medicine Reports
Article Title: Multiplex picoliter-droplet digital PCR for quantitative assessment of EGFR mutations in circulating cell-free DNA derived from advanced non-small cell lung cancer patients
doi: 10.3892/mmr.2017.6712
Figure Lengend Snippet: Primers used for the multiplex droplet digital PCR. The total volume of the PCR mixture was 40 µl, with 0.5 µM each of forward and reverse primers included in each assay.
Article Snippet: Plasmids carrying wild-type (Plasmid #11011) or
Techniques: Multiplex Assay, Digital PCR

Journal: Molecular Medicine Reports
Article Title: Multiplex picoliter-droplet digital PCR for quantitative assessment of EGFR mutations in circulating cell-free DNA derived from advanced non-small cell lung cancer patients
doi: 10.3892/mmr.2017.6712
Figure Lengend Snippet: TaqMan® probes used for the multiplex ddPCR.
Article Snippet: Plasmids carrying wild-type (Plasmid #11011) or
Techniques: Multiplex Assay, Sequencing, Concentration Assay

Journal: Molecular Medicine Reports
Article Title: Multiplex picoliter-droplet digital PCR for quantitative assessment of EGFR mutations in circulating cell-free DNA derived from advanced non-small cell lung cancer patients
doi: 10.3892/mmr.2017.6712
Figure Lengend Snippet: Workflow of the multiplex ddPCR panels. (A) The PCR mixture for each assay consisted of DNA templates, primer pairs, probes, master mix and stabilizer to a final volume of 40 µl and was (B) compartmentalized into >5 million picoliter-sized droplets for independent PCR reactions. (C) The endpoint fluorescence signal of each droplet was scanned and analyzed. (D) Different fluorophores and diverse end point fluorescence intensities distinguished the droplets containing target templates into different clusters. ddPCR, picoliter-droplet digital polymerase chain reaction; WT, wild-type; 19DEL, exon 19 deletions; L858R-1, exon 21 L858R mutation (c.2573T>G); L858R-2, exon 21 L858R mutation (c.2573T>G, c.2574G>T); T790M, exon 20 T790M mutation; FAM, 6-carboxyfluorescein; VIC, green fluorescent protein.
Article Snippet: Plasmids carrying wild-type (Plasmid #11011) or
Techniques: Multiplex Assay, Fluorescence, Digital PCR, Mutagenesis

Journal: Molecular Medicine Reports
Article Title: Multiplex picoliter-droplet digital PCR for quantitative assessment of EGFR mutations in circulating cell-free DNA derived from advanced non-small cell lung cancer patients
doi: 10.3892/mmr.2017.6712
Figure Lengend Snippet: Multiplex picoliter-droplet digital polymerase chain reaction panels for EGFR mutation assays. Two-dimensional histograms of the (A) 4-plex and the (B) 5-plex panels. EGFR, epidermal growth factor receptor; FAM, 6-carboxyfluorescein; VIC, green fluorescent protein; WT, wild-type; 19DEL, exon 19 deletions; L858R-1, exon 21 L858R mutation (c.2573T>G); L858R-2, exon 21 L858R mutation (c.2573T>G, c.2574G>T); T790M, exon 20 T790M mutation.
Article Snippet: Plasmids carrying wild-type (Plasmid #11011) or
Techniques: Multiplex Assay, Digital PCR, Mutagenesis

Journal: Molecular Medicine Reports
Article Title: Multiplex picoliter-droplet digital PCR for quantitative assessment of EGFR mutations in circulating cell-free DNA derived from advanced non-small cell lung cancer patients
doi: 10.3892/mmr.2017.6712
Figure Lengend Snippet: The limit of blank for the multiplex ddPCR panels is generated by observing the false-positive droplet events in assays for each mutant with wild-type templates. Fragmented plasmid containing only wild-type sequence was subjected to the 4-plex and 5-plex panel in 24 replicates. Presented here are the frequency distributions of false-positive events for (A) 19DEL, (B) T790M, (C) L858R-1 and (D) L858R-2. A Poisson model was applied to fit the frequency distribution and LOB for each, as determined by the 95% confidence interval following regression analysis, which is presented by the red cutoff line. 19DEL, exon 19 deletions; L858R, exon 21 L858R mutation; T790M, exon 20 T790M mutation; LOB, limit of blank.
Article Snippet: Plasmids carrying wild-type (Plasmid #11011) or
Techniques: Multiplex Assay, Generated, Mutagenesis, Plasmid Preparation, Sequencing

Journal: Molecular Medicine Reports
Article Title: Multiplex picoliter-droplet digital PCR for quantitative assessment of EGFR mutations in circulating cell-free DNA derived from advanced non-small cell lung cancer patients
doi: 10.3892/mmr.2017.6712
Figure Lengend Snippet: Performance of the multiplex ddPCR panels for quantifying EGFR mutants. Samples with descending mutant abundance were subjected to the 4-plex (A) and 5-plex (C) ddPCR panels. Simple linear regression analysis was applied to the expected abundances of mutant alleles and was plotted against the detected abundances of the 4-plex (B) or 5-plex (D) panels. ddPCR, picoliter-droplet digital polymerase chain reaction; EGFR, epidermal growth factor receptor; FAM, 6-carboxyfluorescein; VIC, green fluorescent protein; 19DEL, exon 19 deletions; L858R-1, exon 21 L858R mutation (c.2573T>G); L858R-2, exon 21 L858R mutation (c.2573T>G, c.2574G>T); T790M, exon 20 T790M mutation.
Article Snippet: Plasmids carrying wild-type (Plasmid #11011) or
Techniques: Multiplex Assay, Mutagenesis, Digital PCR

Journal: Molecular Medicine Reports
Article Title: Multiplex picoliter-droplet digital PCR for quantitative assessment of EGFR mutations in circulating cell-free DNA derived from advanced non-small cell lung cancer patients
doi: 10.3892/mmr.2017.6712
Figure Lengend Snippet: Results generated from plasma cfDNA by multiplex ddPCR panels and tumor tissue DNA by ARMS in advanced NSCLC patients.
Article Snippet: Plasmids carrying wild-type (Plasmid #11011) or
Techniques: Generated, Clinical Proteomics, Multiplex Assay, Mutagenesis

Journal: Molecular Medicine Reports
Article Title: Multiplex picoliter-droplet digital PCR for quantitative assessment of EGFR mutations in circulating cell-free DNA derived from advanced non-small cell lung cancer patients
doi: 10.3892/mmr.2017.6712
Figure Lengend Snippet: Therapeutic monitoring by multiplex picoliter-droplet digital polymerase chain reaction assays on plasma cfDNA EGFR mutations and lung mass imaging scans. Abundance of EGFR mutations in plasma cfDNA fluctuated with tumor size, as revealed by imaging scans. (A) 19DEL abundance persistently decreased when tumors shrank in Case 23. (B) T790M rose with the tumor size in Case 24, which indicated an acquired therapeutic resistance to gefitinib. (C) Case 25 presented a change in T790M abundance after receiving AZD9291 treatment. cfDNA, circulating cell-free DNA; EGFR, epidermal growth factor receptor; Mut, mutant; FAM, 6-carboxyfluorescein; VIC, green fluorescent protein; 19DEL, exon 19 deletions; L858R, exon 21 L858R mutation (either L858R-1 or L858R-2); T790M, exon 20 T790M mutation.
Article Snippet: Plasmids carrying wild-type (Plasmid #11011) or
Techniques: Multiplex Assay, Digital PCR, Clinical Proteomics, Imaging, Mutagenesis